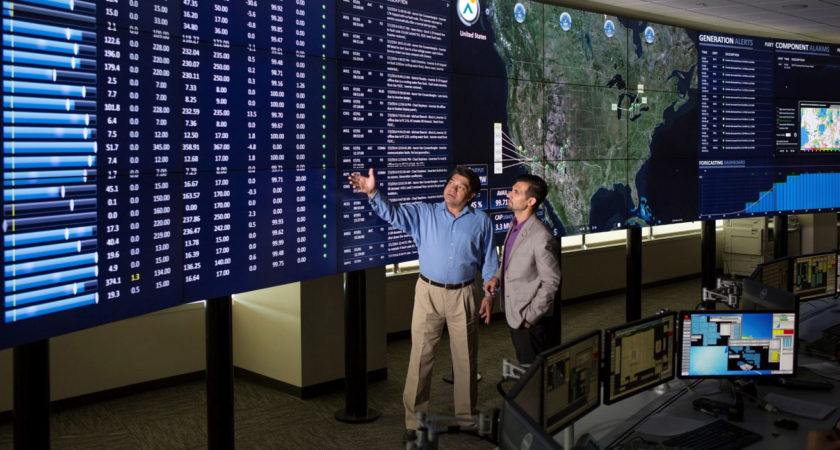
O&M providers should be mindful of two goals. First, they should help you maximize actual equipment capabilities, and they also must help achieve your financial plans. To do this accurately, it is necessary to maintain two performance ledgers – (1) Generation vs. a New & Clean benchmark and (2) Generation vs TMY Predicted values. Tracking on just one ledger could allow un-noticed issues to go unaddressed. Tracking both provides asset owners and financiers a holistic view into both equipment health and long-term projections.
New & Clean
New and Clean” refers to equipment that has zero degradation, zero external loss factors, and operates perfectly as described by the equipment manufacturer documentation. As part of the final commissioning steps, it is important to test the entire facility to establish capability on the commercial operation date as this is the starting point for the post-construction life cycle. This initial benchmarking is important because it will:
- Establish how actual generation compares to pro-forma predictions
- Document equipment that is operating above or below the manufacture’s projections
- Provide insight into unexpected loss factors such as shading from boundary objects
This also allows for discovered systemic issues to be addressed before the EPC or equipment warranty periods expire.
Another benefit of base-lining day-one performance is the ability to assess recoverable and non-recoverable degradation.
Soiling is an example of recoverable degradation as this performance loss can be “recovered” by proper cleaning. One benefit of a New & Clean baseline is that it enables accurate financial analysis. Determining optimized wash timing to address soiling is one such example.
Stress from daily heat-cool thermal cycles or destructive UV irradiance effects are examples of non-recoverable degradation. Baselining allows one to measure these long-term losses over time. Discovering and documenting accelerated long-term degradation will greatly assist in signaling a need for major corrective action or submit a long-term warranty claim.
Determining either of the above loss factors is greatly facilitated if the site has been properly benchmarked at New & Clean. A plant-wide capacity test is one effective method to do this. Performance KPIs for all major equipment should be established during initial testing as well, and this will assist accurate diagnostics for impending operational issues. We use and recommend the guidance referenced in papers [1] and [2] for running capacity tests.
Average Year (TMY) Predicted Performance
Predicted generation is an important entry into your project’s performance as these values have significant leverage on sales price, loans, resale value, and projected life-cycle income. Historical weather is the solar resource when prospecting a project, and this is often represented as the Typical Meteorological Year (TMY). Predicting generation from TMY data is calculated with a complex model based on the PV plant design and other environmental conditions, and the results are often stored in 8760 entries that represent all hours of a nominal year.
The second important performance ledger is weather correcting the measured generation and then comparing this to the (TMY) predicted generation. This provides the ability to compare how the site is actually performing when compared to business plans.
(c) 2020, Timothy Dierauf, NovaSource Power Services
[1] A Fundamentals Approach to (PV) Plant Capacity Testing, September 22, 2014, EU PVSEC 2014, Amsterdam
[2] IEC 61724, Part 1, 2, &3, Photovoltaic System Performance, 2017, 2016, 2016, International Electronics Commission (IEC)