Aerial Inspection LTSA
Our Approach
We are solar DC (direct current) health experts, dedicated to diagnosing risks and underperformance in your solar fleet, and identifying opportunities to optimize for life cycle asset performance, reliability, and predictability.
We specifically do this by analyzing, validating, and contextualizing the photovoltaic (PV) system data we collect from individual solar energy projects (10,000+ to date) against our global database, to understand better how these projects will perform over their expected lifetime.
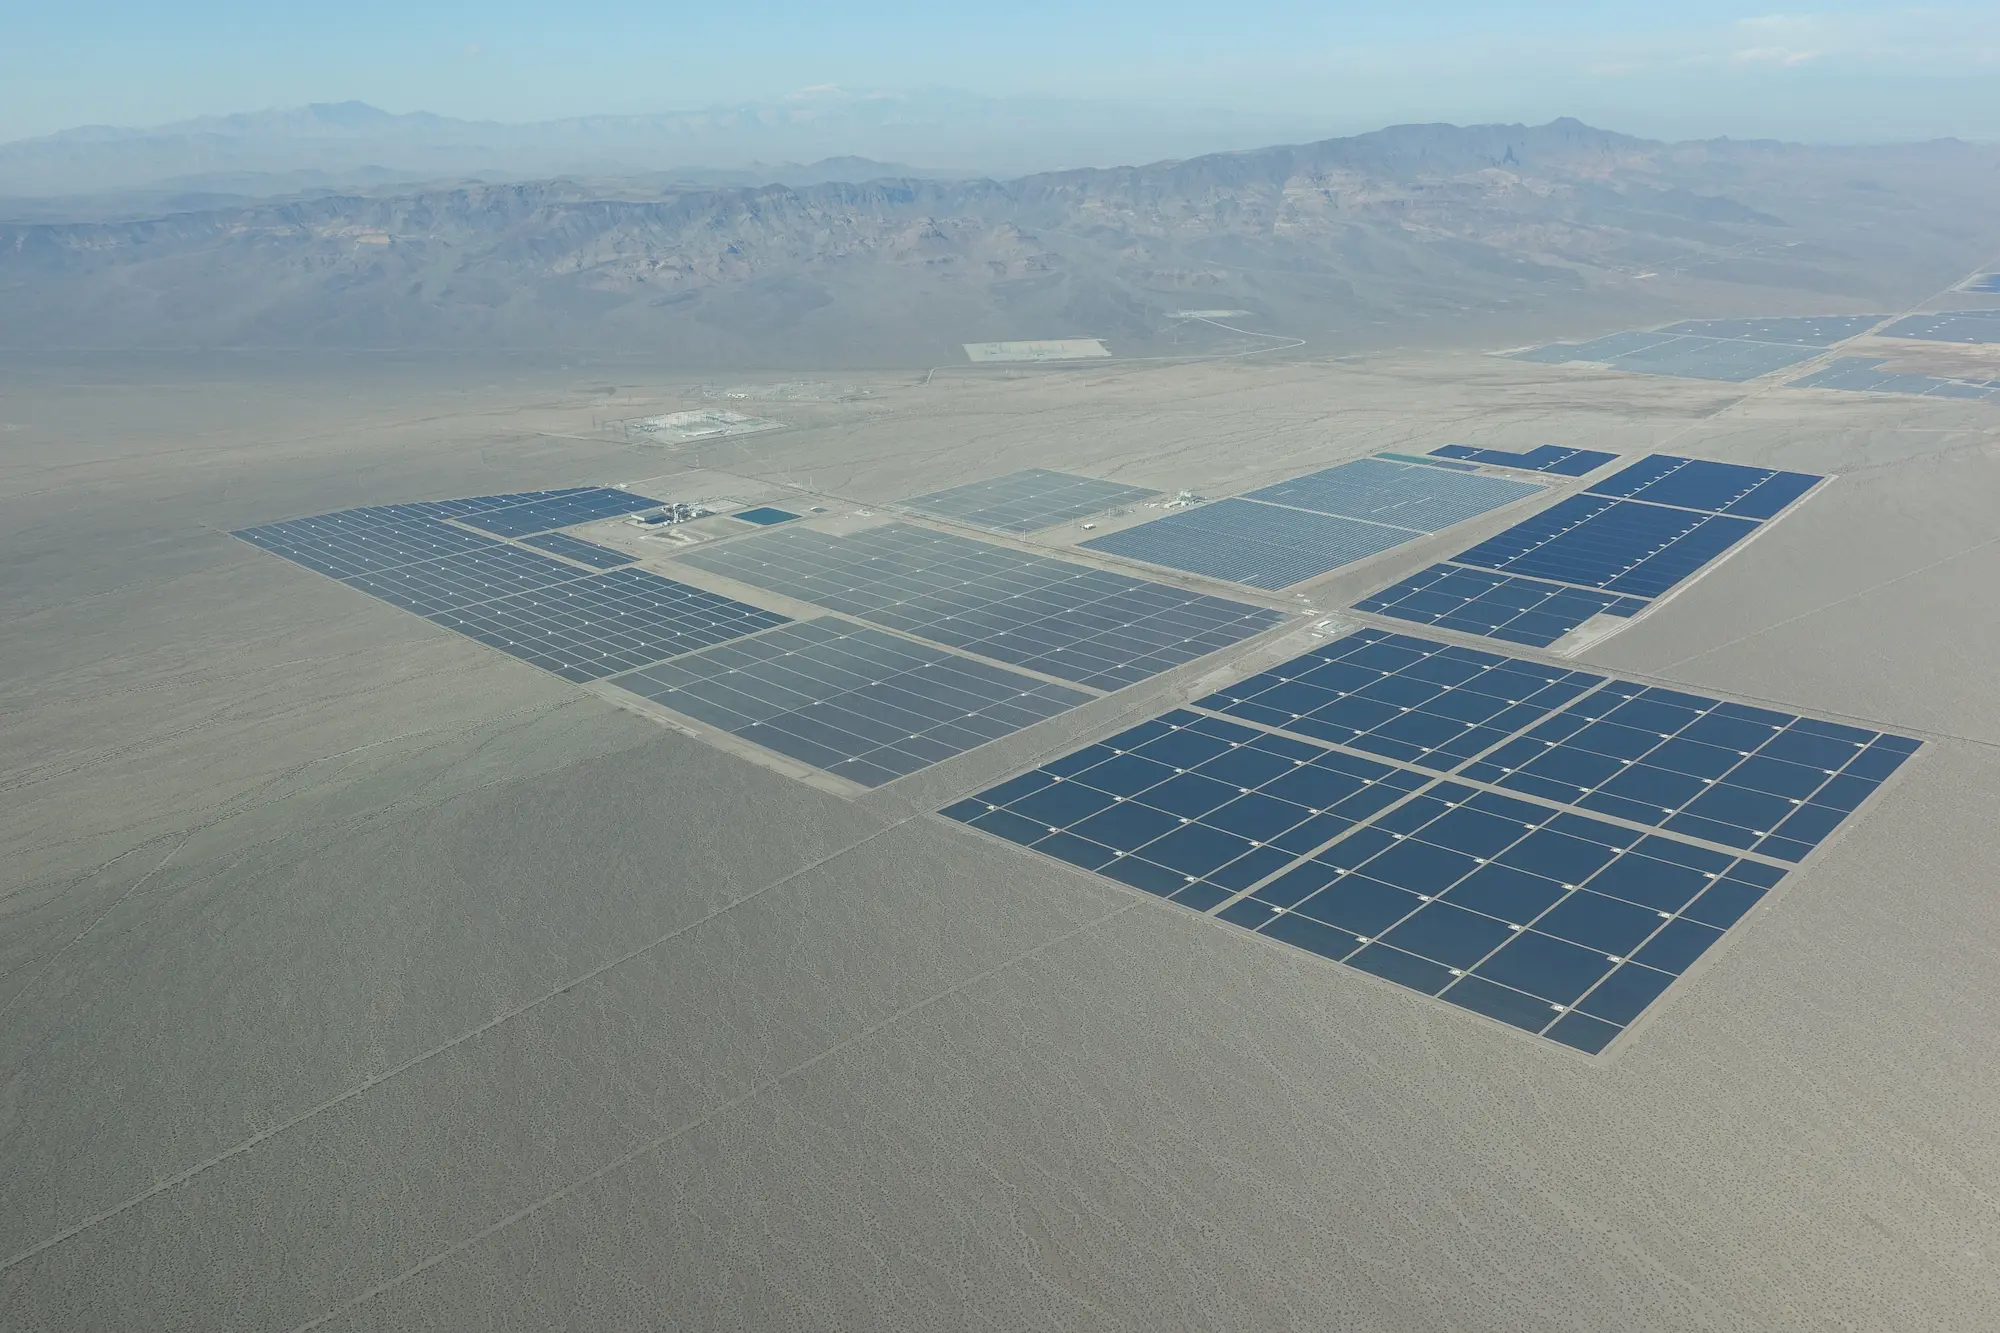
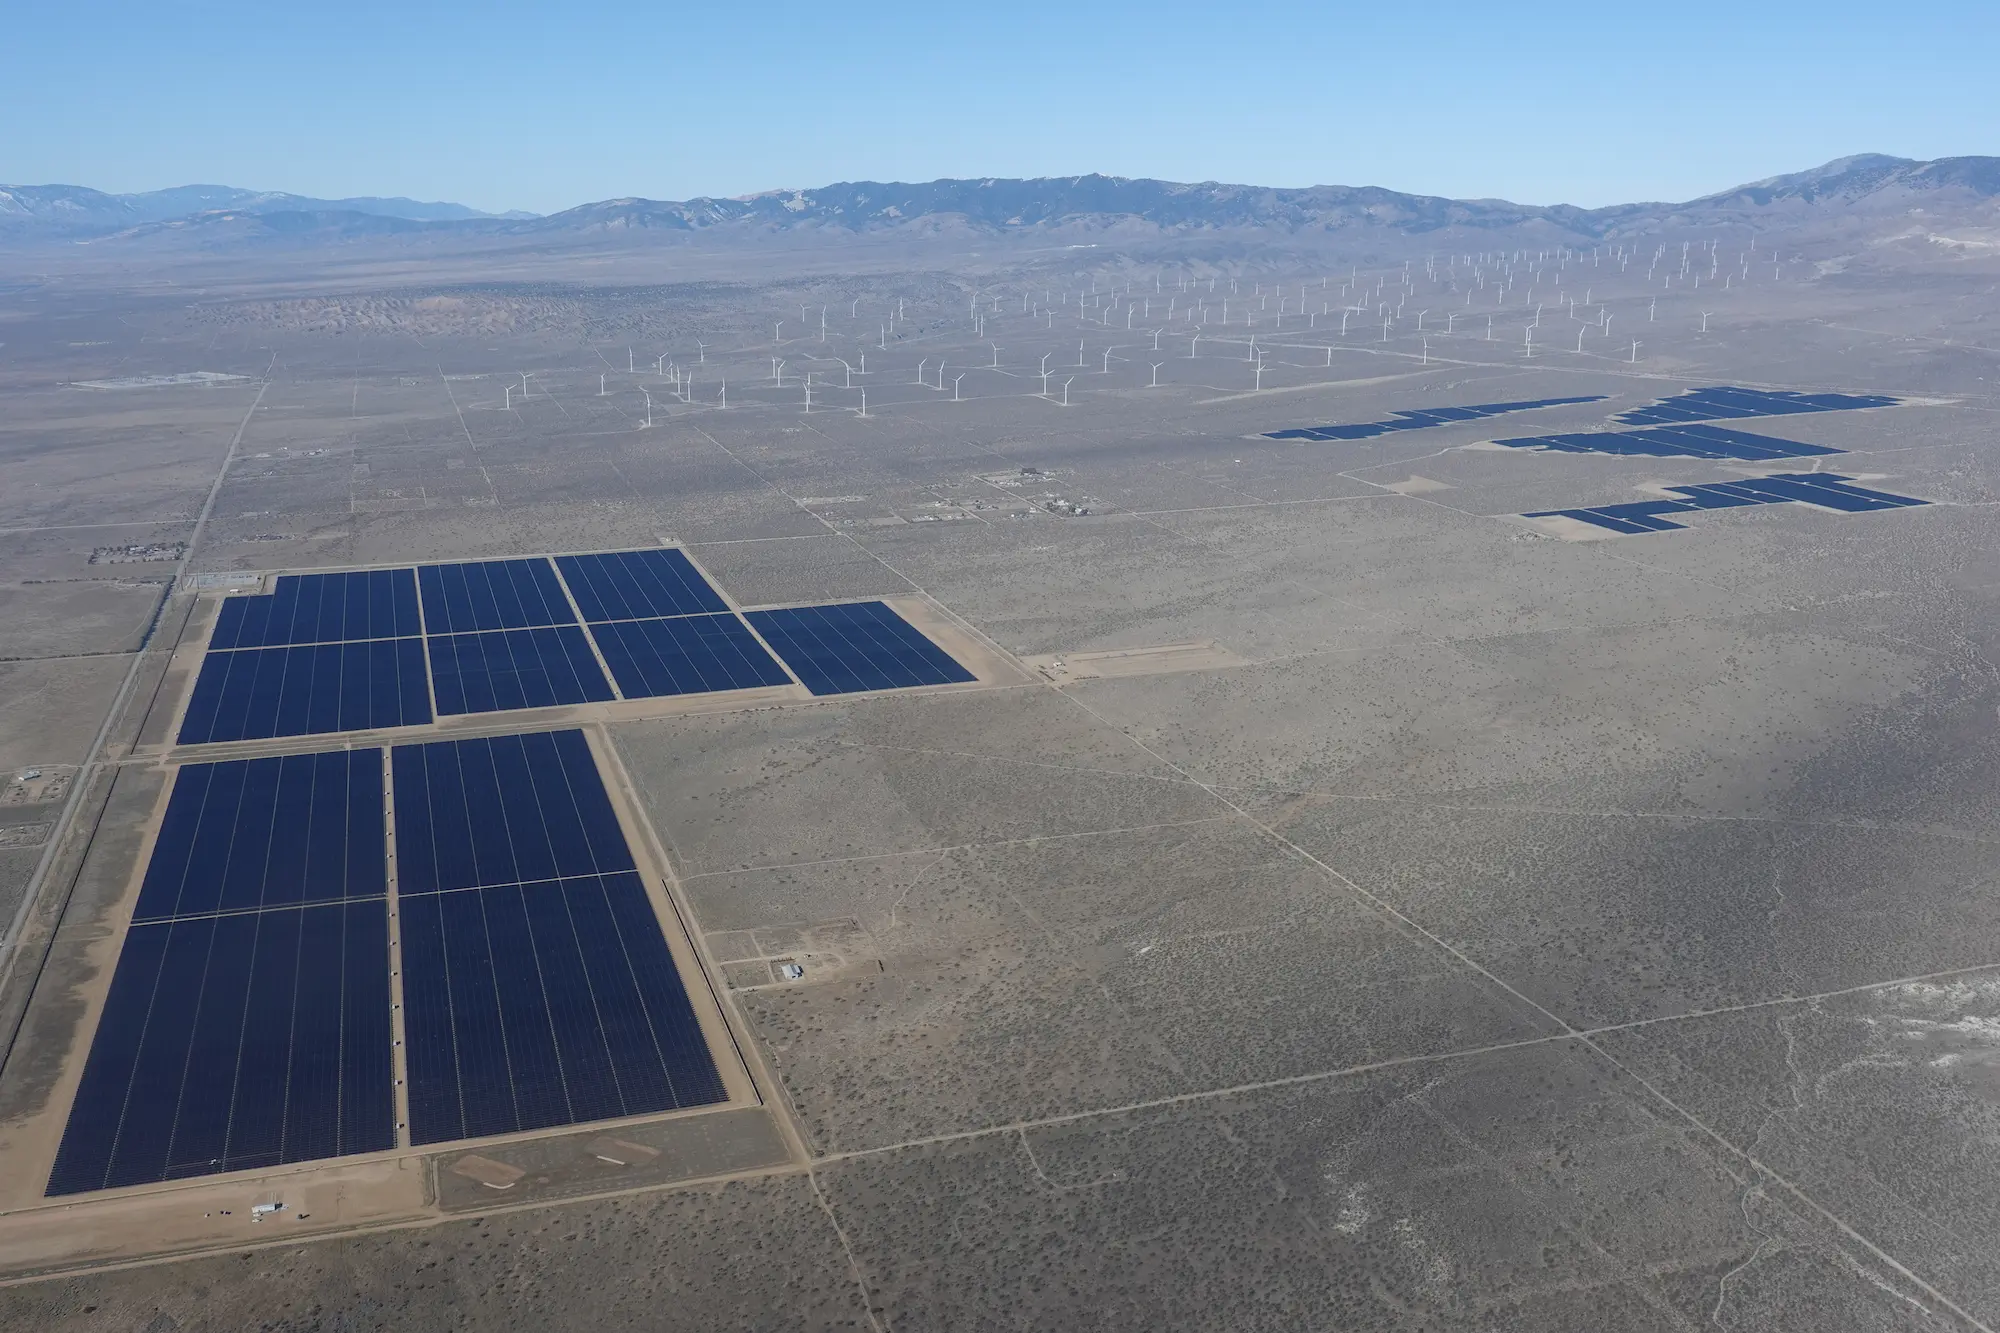
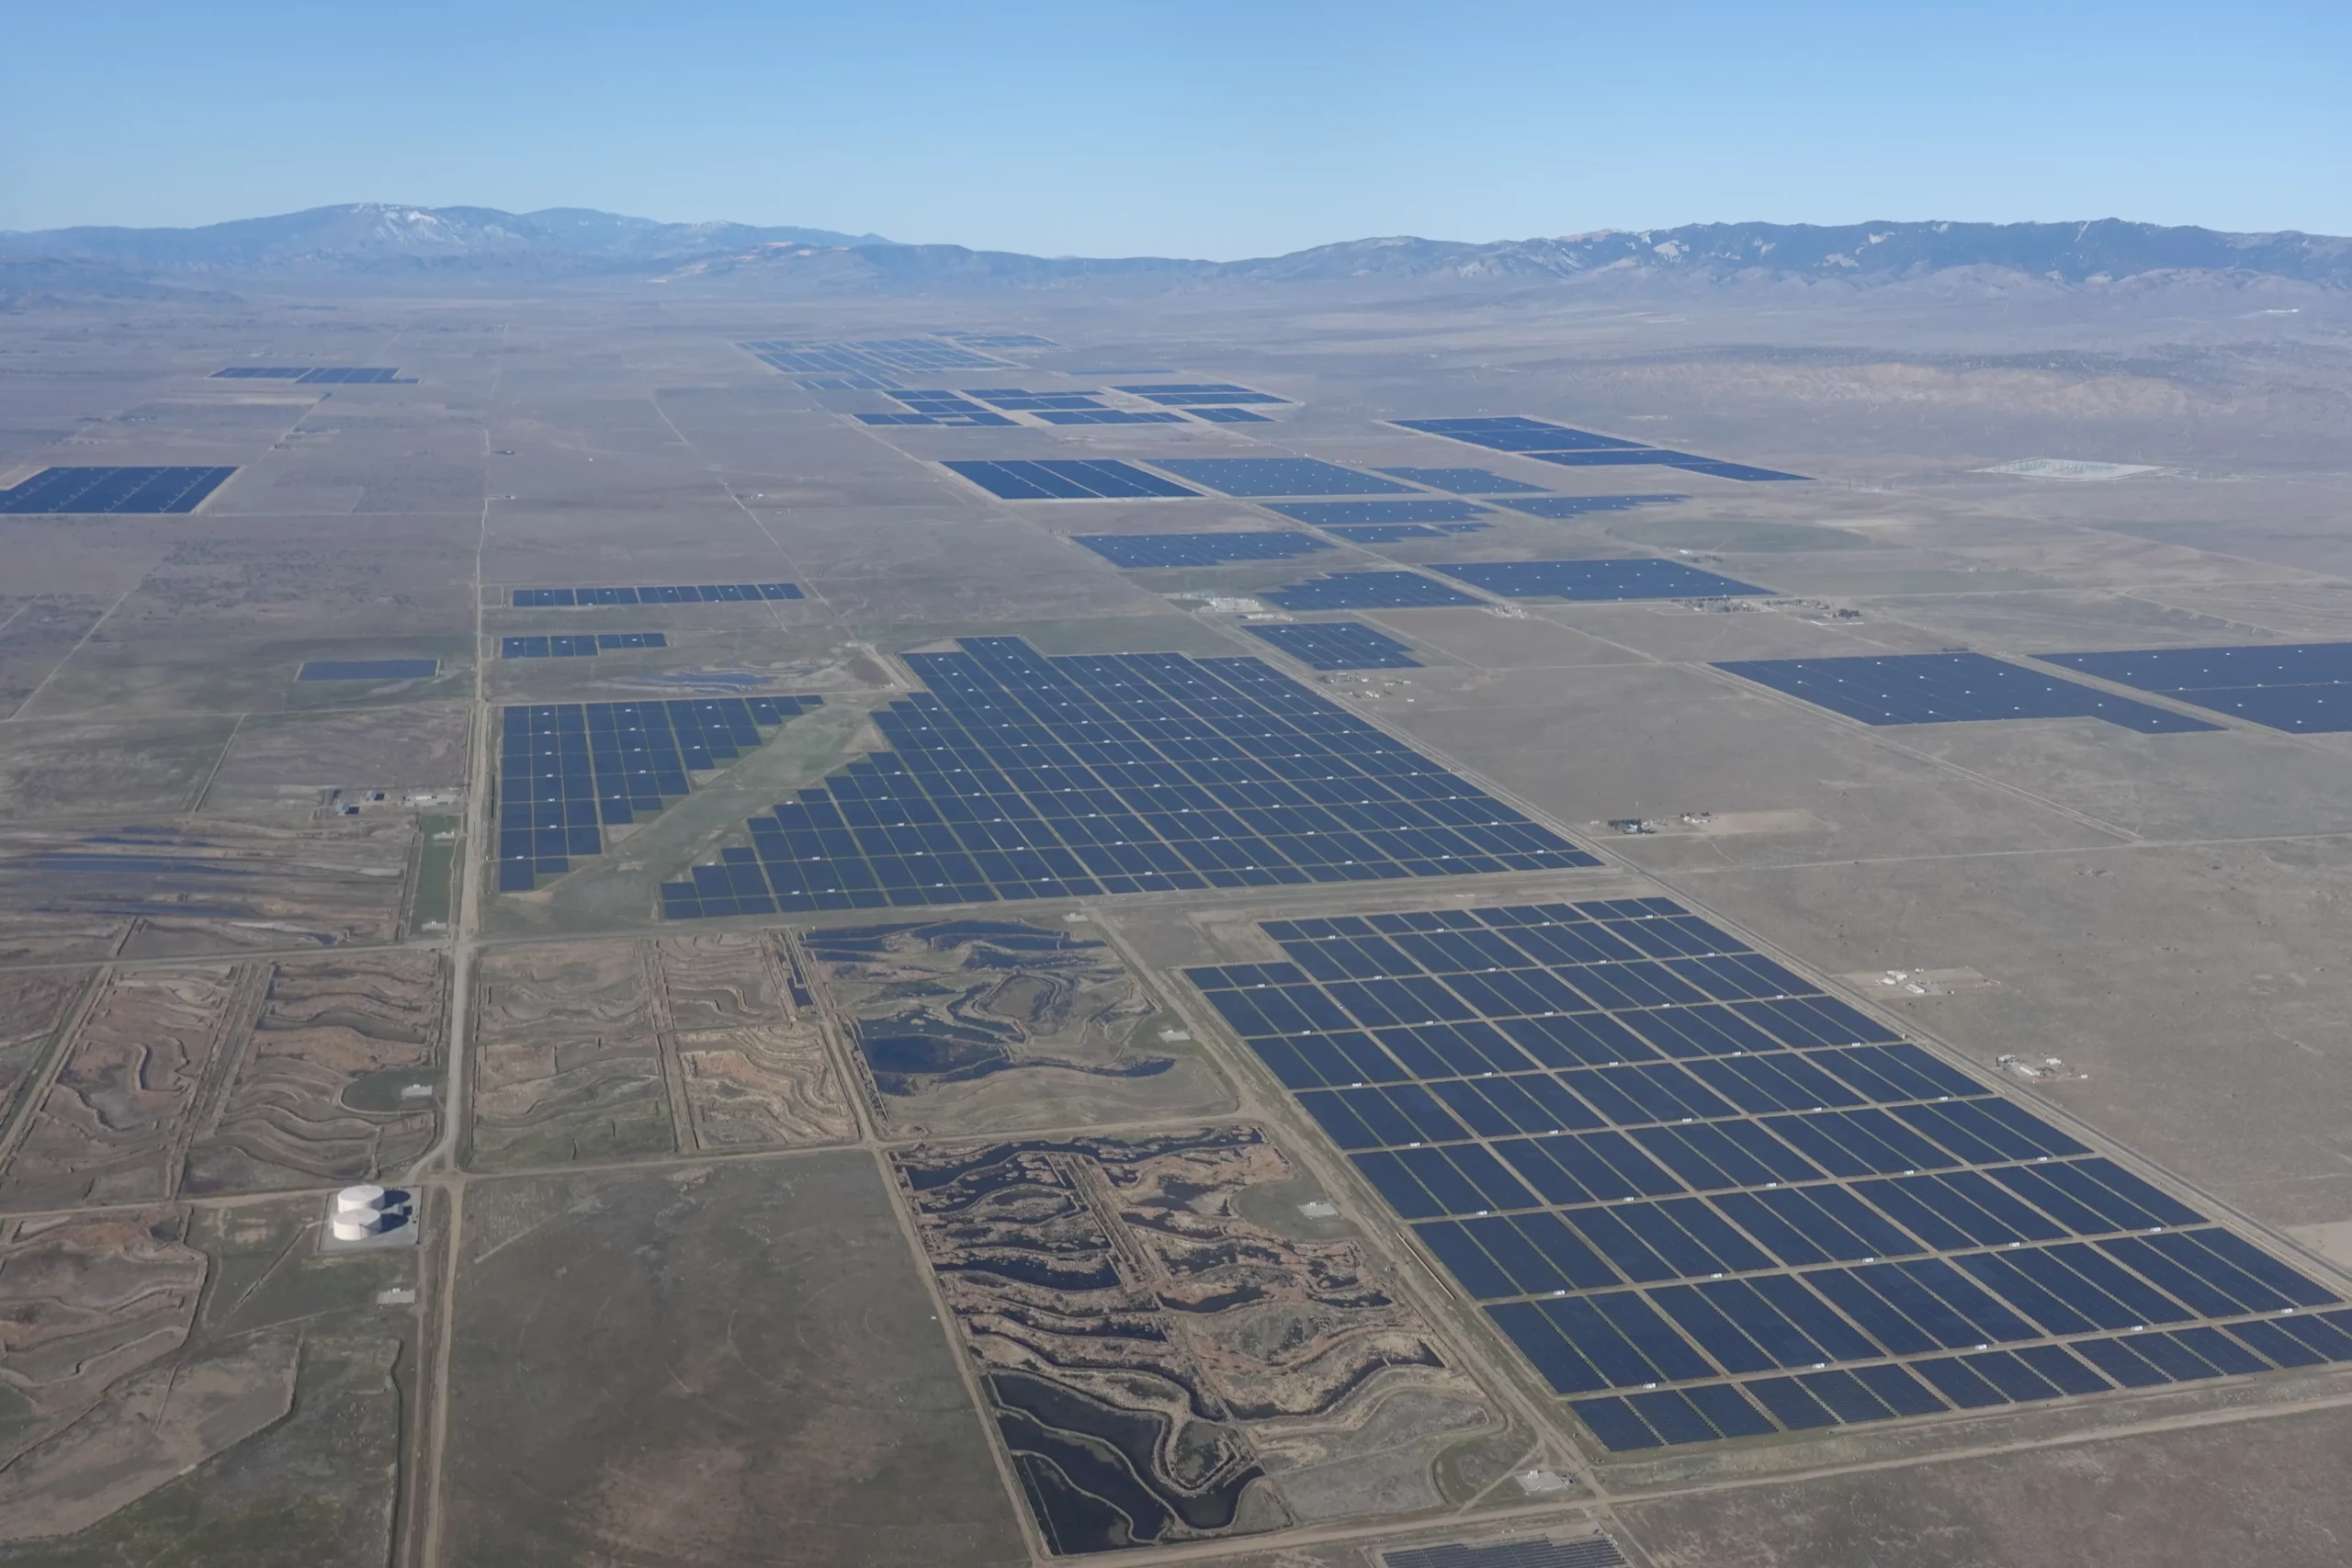
We begin by performing a high-resolution aerial inspection of the proposed site(s) using piloted aircraft fitted with our PV sensing technology to gather aerial infrared (IR) and visual imagery of the site(s). These sensors are highly attuned at a resolution capable of detecting DC system-level, module-level, and cell-level thermal defects and anomalies.
Aerial Inspection Services Process

Aerial inspection + site data capture
Our preferred method is to use our proprietary aircraft-mounted PV inspection sensor package to provide the highest quality and consistency of data capture. We also utilize drone inspections as needed, giving us the flexibility to coordinate the right level of inspection.

Analysis
We perform in-depth analyses to precisely detect, categorize, map, and validate DC anomalies against our global fault database. Analysis tiers include Module Advanced, Module Basic, and LTSA Scope levels of analytical reporting.
Our reports highlight key information via detailed site schematics, precise anomaly mapping, and statistical insights to enable technicians to spend PM time on what matters most. Technicians can arrive onsite prepared to immediately perform remediation and repair work, confidently and safely, thanks to the accuracy and reliability of our reports.

Upgrade if required
In the case that persistently low DC performance is occurring and the site has been contracted at the LTSA scope, upgrading analysis is always an option. We can go back to the original data to reperform analysis in greater detail at either the Module Basic or Module Advanced scope.
Upgrading analysis of a site is especially useful for collecting sufficient data to submit warranty claims or identify advanced modes of module degradation and underperformance. Our team can help to identify which upgraded level of analysis is right for your goals.
INSPECT – Aerial Thermographic Inspections

Aircraft
Advantages of using aircraft:
- Increased data consistency
- High-resolution data is collected at a rate of 100 MW/hr
- High capture speeds ensure minimal irradiance variation
- Sensors 8X-15X higher resolution than drones
- Less administrative burden for our clients
- Higher thermal sensitivity
- Hardware is continuously upgraded, improving accuracy and range of detectability
- Able to investigate large portfolios efficiently at a low cost
Aircraft is best suited for:
- Solar dense regions
- Large scale assets
- DG portfolios
- Condition-based inspections

Drones
Advantages of using drones:
- Available worldwide
- Higher scan flexibility
- Ability to deploy simultaneously in different regions
Drones are best suited for:
- Remote assets
- Countries with low solar density
- Countries with difficult regulatory environments
- Internal drone programs
Module Advanced
Our most in-depth report, the Module Advanced Report identifies all IR anomalies on-site including the detection of subtle performance or site concerns, such as cell cracking, potential induced degradation (PID), vegetation, surface fouling, and installation defects. This scope also includes the identification of BOS performance concerns, classification of anomalies into remediation or monitoring prioritization categories, and data collection for warranty returns of major anomaly modes, if required. Optimized for on-site remediation and contractual compliance.
Online Portal
Site schematics
(Detailed mapping of all faults identified)
Fault listing
Secure, 5-year data storage
Module Advanced Report Includes
Inverter outages
Sectional outages
String outages
Module-level faults
Sub-module-level faults
Hot spots
Junction box heating issues
Broken modules
Missing modules
Acute surface defects
(dirt, dust, debris, bird droppings)
Major racking issues
Tracker misalignment
Systemic shading
Potential Induced Degradation
Warrantable defects
Module Basic
Our Module Basic Report includes the identification of all anomalies with major energy impacts. This scope can also include data collection for warranty returns of major anomaly modes if required, as well as mapping of anomalies for efficient remediation.
Online Portal
Site schematics
(Detailed mapping of identified faults included inModule Basic Analysis)
Fault listing
Secure, 5-year data storage
Module Basic Report Includes
Inverter outages
Sectional outages
String outages
Module-level faults
Sub-module-level faults
Hot spots
Broken modules
Missing modules
Major racking issues
Tracker misalignment
Warrantable defects
LTSA Scope
Our LTSA Scope Report includes identification of major energy losses and mapping of anomalies for efficient remediation.
Site schematics
(Detailed mapping of identified faults included inModule Basic Analysis)
Fault listing
Secure, 5-year data storage
LTSA Scope Report Includes
Inverter outages
Sectional outages
String outages
Broken modules
Most Common Add-Ons
- Increased data consistency
- High-resolution data is collected at a rate of 100 MW/hr
- High capture speeds ensure minimal irradiance variation
- Sensors 8X-15X higher resolution than drones
- Less administrative burden for our clients
- Higher thermal sensitivity
- Hardware is continuously upgraded, improving accuracy and range of detectability
- Able to investigate large portfolios efficiently at a low cost
Most Common Consulting Requests
- Warranty and/or insurance claim support
- Storm response
- Capacity testing, electroluminescence (EL) testing, and in-field testing
- Real-time construction assessment and monitoring
- Erosion Analysis
- Root cause issue identification
- Site lifetime degradation analysis
- Special project consulting
ANALYZE – Three Stages of Degradation Assessment
NovaSource Power Services delivers end-to-end solutions for evaluating and tracking PV system degradation, ensuring long-term performance and reliability. Our expert assessments and advanced monitoring empower solar asset owners to optimize efficiency, maximize ROI, and extend the lifespan of their photovoltaic systems.
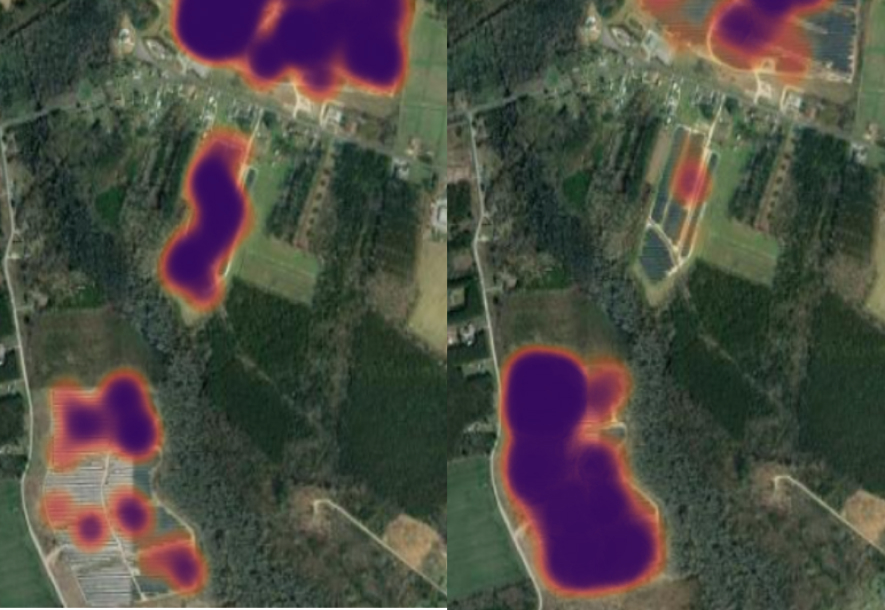
Aerial IR inspections to identify acute DC degradation (recoverable) modes, like module and string failure.
Data above shows the fault relationship breakdown by energy impact for an aerial IR scan, along with a heat-map representation of two different systemic issues on site.
SCADA-based data analytics to identify overall performance.
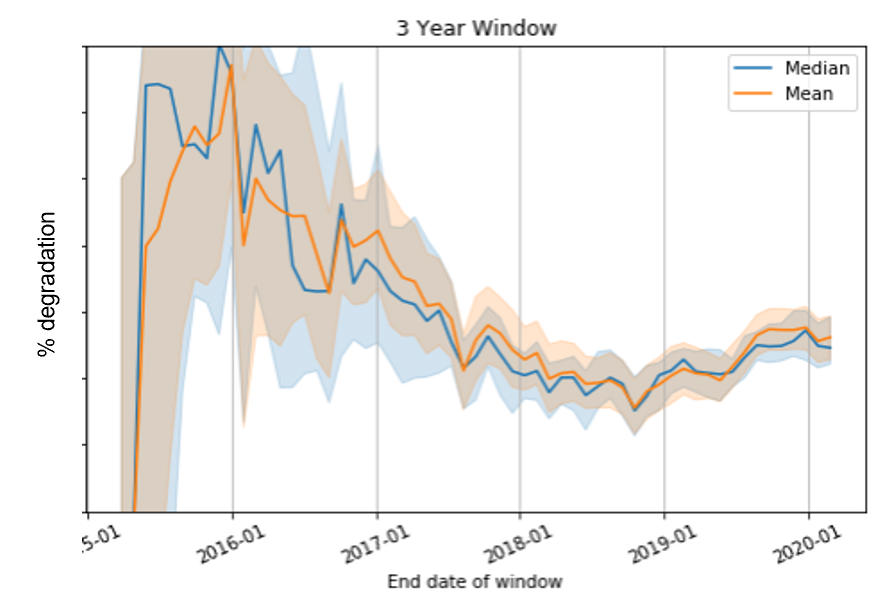
SCADA-based degradation analysis, including windowed temporal analytics, allows a determination of systemic degradation trends.
Data above shows the average degradation trend for a 300-site portfolio, revealing a recent recovery in portfolio average degradation rate.
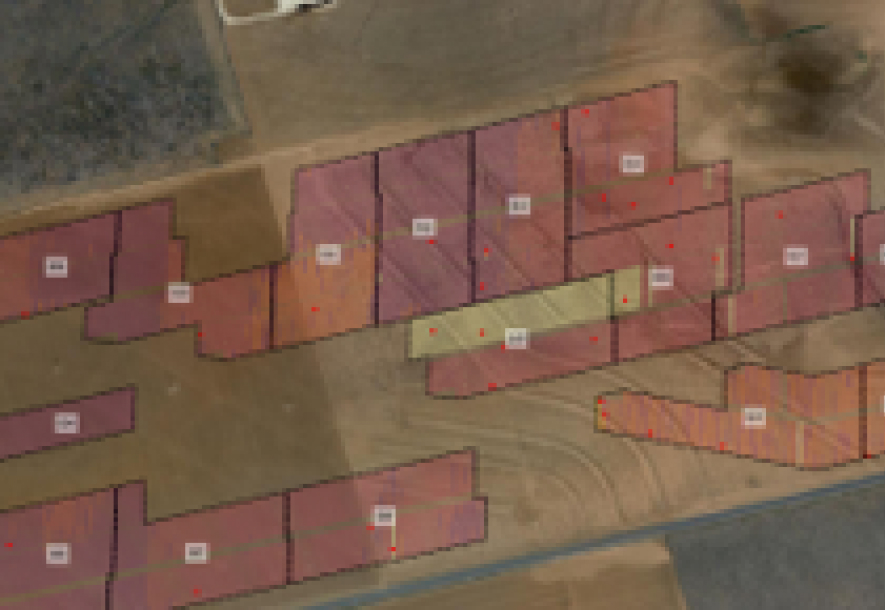
Targeted I-V to detect non-recoverable degradation.
Our team develops customized module-level sampling plans using your as-built system layout, then analyzes injected I-V data to predict batch-specific degradation with precision. This targeted approach delivers actionable insights, helping you optimize performance and prioritize maintenance for maximum ROI.
Data above shows module power class distribution shown by different colors on the map. Sampling locations are the red dots representing a sample from each bin and resulting I-V data.
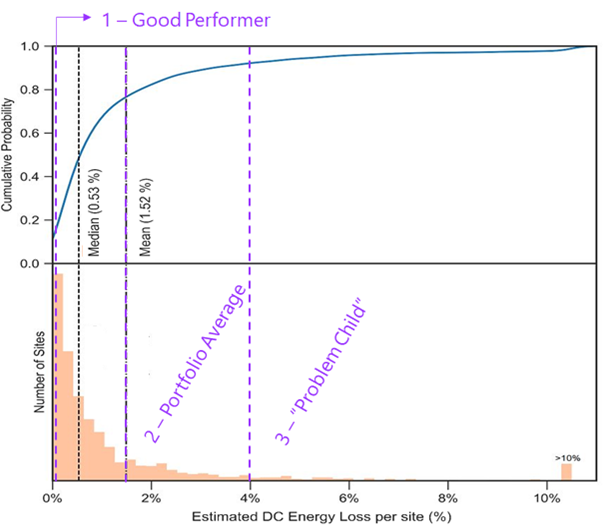
Our Learnings from 70 GW of Inspections
Across all sites, we have identified a one-sided distribution with a long tail of underperformance due to DC health issues.
This can be summarized into three categories:
1 – Good Performer
Negligible energy loss on site. Top 10% of sites in a portfolio.
2 – Portfolio Average
On average, inspections identify 1.5% of DC energy loss due to faults. Distribution is skewed, and mean is > median – here approx. 75% of sites perform better than average DC energy loss. Average value is used in this case since overall portfolio O&M spending is likely to scale with average portfolio loss.
3 – “Problem Child”
Lower 10% of sites in a portfolio. Approx. 4% DC loss or greater.
Looking to contact HR? Click here.