Do you have a PV Plant that performs well on sunny days and not so well on cloudy days? The issue may not be your equipment, just your mathematics. Let’s illustrate this with a facility that has a high DC to AC ratio. In other words, the array is oversized, and the inverters will clip at upper limits during high insolation.
The following is high-resolution data plotted from one of our facilities during a partly cloudy morning. Predicted generation from the project model is also shown:
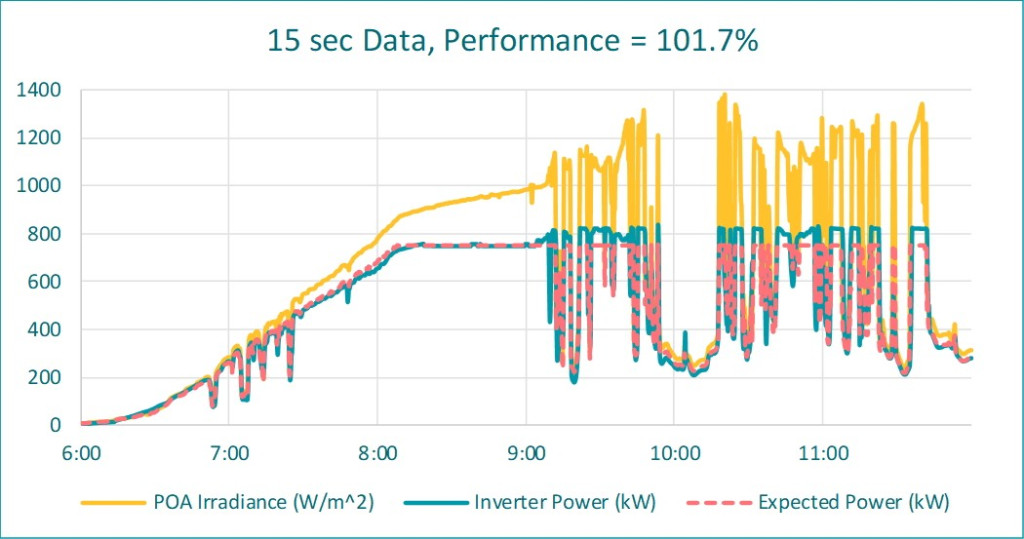
One can see that when stable sunny, the measured and modeled generation are in tight agreement. However, the inverter cannot follow the large measured irradiance spikes caused by cloud reflections. Power is clipped because of internal and external controls. The performance index is 102% when running the performance calculations on the high frequency data. Very nice!
In our reporting, however, performance metrics are often calculated on hourly intervals. And, there are two common reasons for this: (1) Pro-forma models are based on hourly weather (TMY) datasets, and it is this data that is used for weather corrected performance metrics. (2) the weather correction methods can be complex, and it may not be computationally possible to execute these intricate equations at high frequency.
This will not be a problem if cause-and-effects responses are somewhat linear. We average the real time data; push these averages into the performance calculations, and we are hoping that the following relationship is true:

To unpack this, the function of averaged input values (left-hand side) will have the same result as running the function on every input value, and then taking the average of all the results (equation right-hand side).
Unfortunately, this is not true for non-linear situations, and when the inverter clips and cannot follow the irradiance spikes makes this a non-linear situation. This next plot takes hourly averages from the first plot and then computes the performance metric:
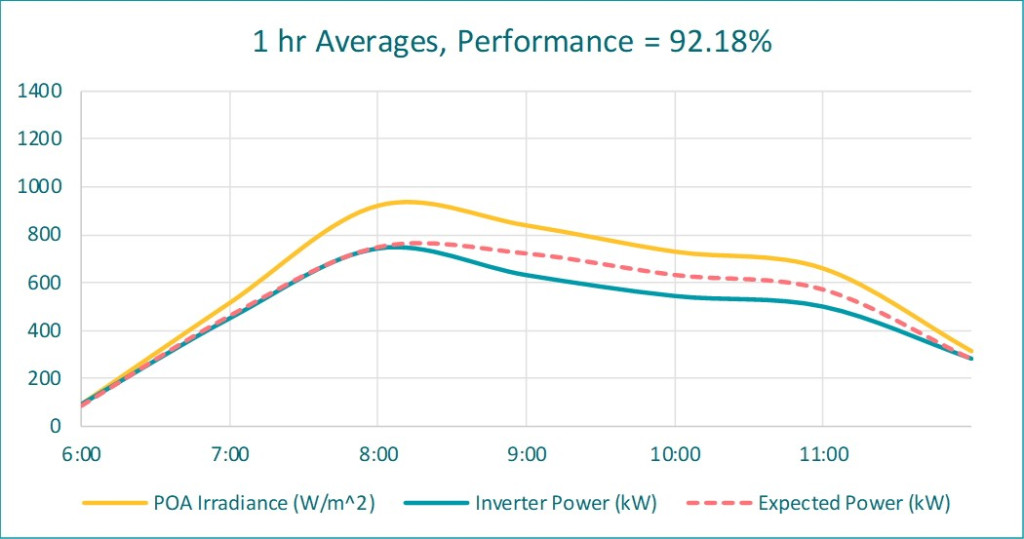
The performance index for hourly averages is 92%. This is a false under-reporting of 10% (!), and we do not want to report a false low performance.
One solution could be executing the averaging calculations more frequently. But, how frequent? The following plot shows the results using 5-minute averages:
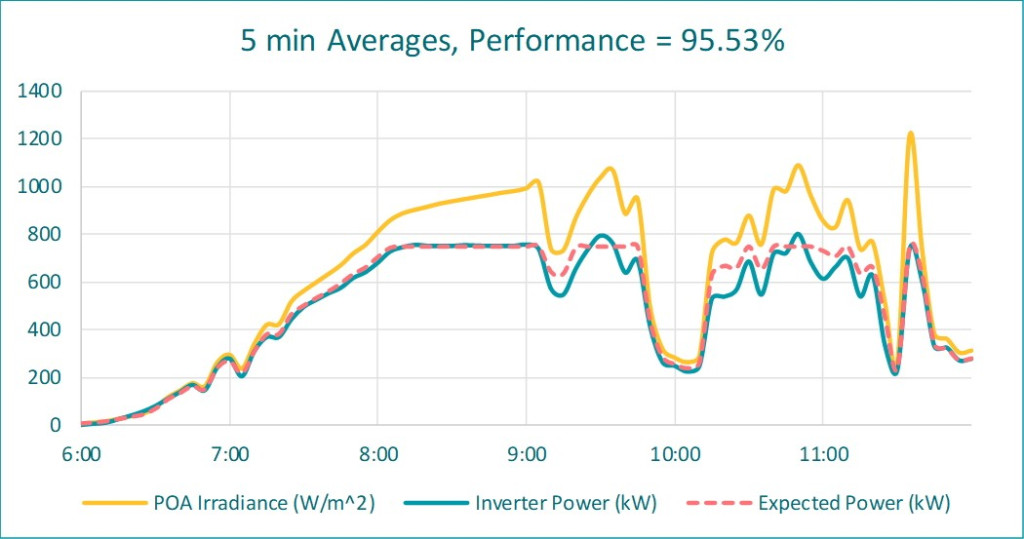
There is still a false under-reporting of 6%. This is not a good outcome either if contract obligations are measured by this type of evaluation.
The purpose of this article is to bring awareness to this computational artifact. Thus far, we have reviewed this effect on a partly cloudy morning. On an annual basis, we have noticed a 3% false under reporting at some of our facilities.
So, what is a “good” calculation frequency? Unfortunately, the answer is situationally dependent (weather volatility, data collection frequency, aggregation method, model complexity, and computing resources). At a minimum, run similar scenarios as presented here to understand the sensitivities for your situation. In the end, be aware. Special consideration may be required when financial agreements are dependent on automated computations such as this.